Remarks
본 포스팅은 https://datascienceschool.net/view-notebook/d0b1637803754bb083b5722c9f2209d0/을 기반으로 작성되었습니다.
0. Import libraries
import numpy as np
import matplotlib as mpl
import matplotlib.pyplot as plt
%matplotlib inline
I. Line plot
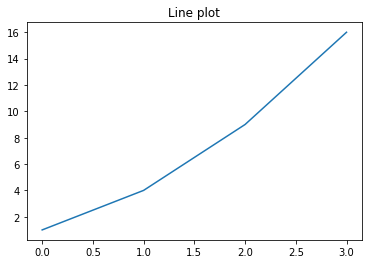
plt.title("Line plot")
plt.plot([1, 4, 9, 16])
plt.show()
1. Tick of x-axis
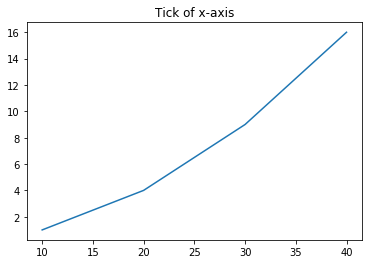
plt.title('Tick of x-axis')
plt.plot([10, 20, 30, 40], [1, 4, 9, 16])
plt.show()
2. Styles
plt.title("'rs--' style plot")
plt.plot([10, 20, 30, 40], [1, 4, 9, 16], 'rs--')
plt.show()
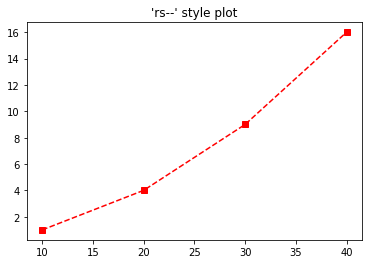
style string: color (r) → marker (s) → line style (–)
Example
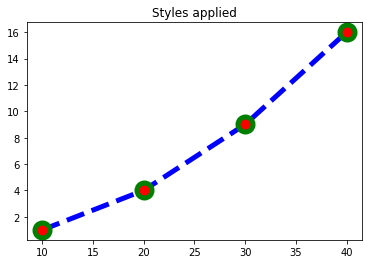
plt.plot([10, 20, 30, 40], [1, 4, 9, 16], c='b',
        lw=5, ls='--', marker='o', ms=15, mec='g', mew=5, mfc='r')
plt.title("Styles applied")
plt.show()
1) Colors
| Option | Color | – | – | – | – | – | – |
|---|---|---|---|---|---|---|---|
b |
blue | g |
green | r |
red | w |
white |
c |
cyan | m |
magenta | y |
yellow | k |
black |
2) Markers
| Option | Marker | – | – | – | – |
|---|---|---|---|---|---|
. |
int marker | 1 |
tri_down marker | s |
square marker |
, |
pixel marker | 2 |
tri_up marker | p |
pentagon marker |
o |
circle marker | 3 |
tri_left marker | * |
star marker |
v |
triangle_down marker | 4 |
tri_right marker | h |
hexagon1 marker |
^ |
triangle_up marker | D |
diamond marker | H |
hexagon2 marker |
< |
triangle_left marker | d |
thin_diamond marker | + |
plus marker |
> |
triangle_right marker | x |
x marker |
3) Line styles
| Option | Line styles | – | – |
|---|---|---|---|
- |
solid line style | -- |
dashed line style |
-. |
dash-dot line style | : |
dotted line style |
4) Other styles
| Style | Option | – | – |
|---|---|---|---|
| color | c |
marker size | ms |
| line width | lw |
marker edge color | mec |
| line style | ls |
marker edge width | mew |
| marker | marker |
marker face color | mfc |
3. Axis range
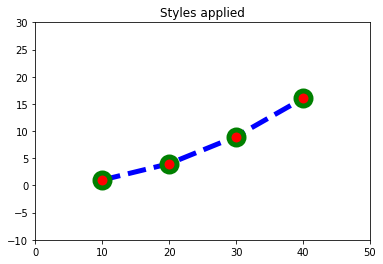
plt.title("Styles applied")
plt.plot([10, 20, 30, 40], [1, 4, 9, 16], c='b',
        lw=5, ls='--', marker='o', ms=15, mec='g', mew=5, mfc='r')
plt.xlim(0, 50);  plt.ylim(-10, 30)  # plt.axis([0, 50, -10, 30])
plt.show()
4. Tick setting
Tick: Plot이나 chart에서 axis상의 위치 표시 지점
Tick label: Tick에 써진 숫자 혹은 글자
II. Bar chart
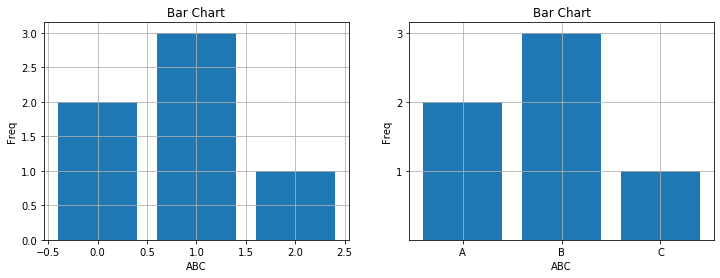
bar의 첫 번째 인수는 bar의 중간지점을 나타낸다
y = [2, 3, 1]
x_pos = np.arange(len(y))

plt.figure(figsize=(12, 4))
plt.subplot(121)
xlabel = ['A', 'B', 'C']
plt.title("Bar Chart")
plt.bar(x_pos, y)
# plt.xticks(x, xlabel);  plt.yticks(sorted(y))
plt.xlabel('ABC');      plt.ylabel('Freq')
plt.grid()

plt.subplot(122)
xlabel = ['A', 'B', 'C']
plt.title("Bar Chart")
plt.bar(x_pos, y)
plt.xticks(x, xlabel);  plt.yticks(sorted(y))
plt.xlabel('ABC');      plt.ylabel('Freq')
plt.grid()

plt.show()
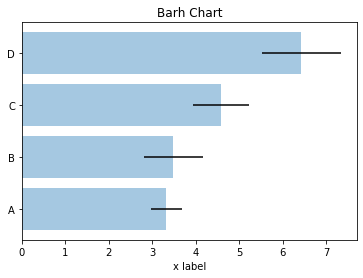
xerr or yerr를 지정하면 error bar를 추가할 수 있다.
people = ['A', 'B', 'C', 'D']
y_pos = np.arange(len(people))
performance = 3 + 10 * np.random.rand(len(people))
error = np.random.rand(len(people))

plt.title('Barh Chart')
plt.barh(y_pos, performance, xerr=error, alpha=0.4)
plt.yticks(y_pos, people)
plt.xlabel('x label')
plt.show()
III. Stem plot
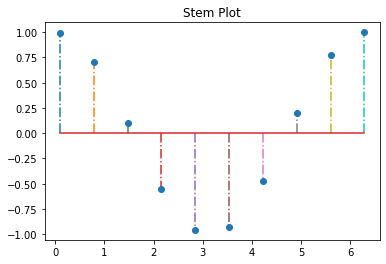
Bar chart와 유사하지만 width가 없다. 주로 이산 확률 함수나 자기상관관계(auto-correlation)를 묘사할 때 사용된다.
x = np.linspace(0.1, 2 * np.pi, 10)

plt.title("Stem Plot")
plt.stem(x, np.cos(x), '-.')
plt.show()
VI. Pie chart
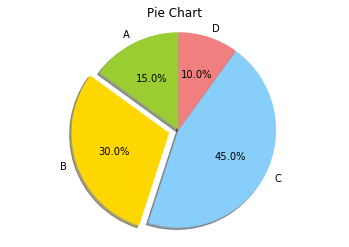
Category 별 값의 상대적인 비교를 할 때 사용된다.
labels = ['A', 'B', 'C', 'D']
sizes = [15, 30, 45, 10]
colors = ['yellowgreen', 'gold', 'lightskyblue', 'lightcoral']
explode = (0, 0.1, 0, 0)

plt.title('Pie Chart')
plt.pie(sizes, explode=explode, labels=labels, colors=colors, autopct='%1.1f%%', shadow=True, startangle=90)
plt.axis('equal')
plt.show()
V. Histogram
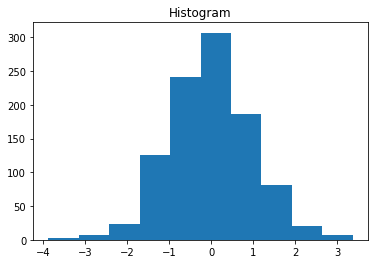
x = np.random.randn(1000)

plt.title('Histogram')
arrays, bins, patches = plt.hist(x, bins=10)
plt.show()
VI. Scatter plot
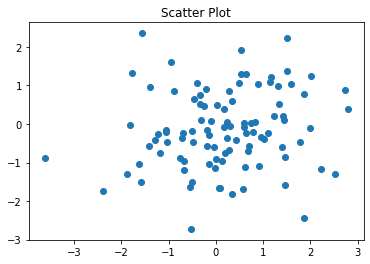
2차원 실수 데이터의 상관관계를 살펴볼 수 있다.
X = np.random.normal(0, 1, 100)
Y = np.random.normal(0, 1, 100)

plt.title('Scatter Plot')
plt.scatter(X, Y)
plt.show()
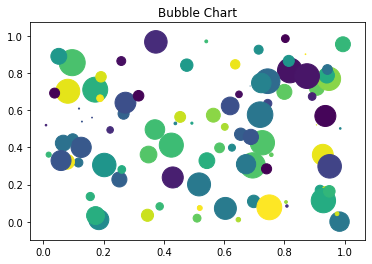
Bubble chart
3차원, 4차원의 경우 점 하나의 크기와 색깔을 통해 다른 데이터 값을 나타낼 수 있다.
이런 차트를 bubble chart라고 한다.
N = 100
x = np.random.rand(N)
y1, y2, y3 = np.random.rand(N), np.random.rand(N), np.pi * (15 * np.random.rand(N))**2

plt.title("Bubble Chart")
plt.scatter(x, y1, c=y2, s=y3)
plt.show()
VII. Box plot
Box plot은 histogram과 비슷하지만 많은 자료 집합의 특성을 동시에 정확하게 나타낼 수 있다. 여러 개의 변수의 분포나 outlier를 판별할 때에도 도움이 된다.
import numpy as np

x = np.random.rand(1000, 2)

fig, ax = plt.subplots(figsize=(20, 5))
plt.boxplot(x)

plt.grid();  plt.setp(ax, xticklabels=['1st', '2nd'])
plt.xlabel('data set')
plt.ylabel('standard normal')
plt.title('Box Plot');

VIII. Imshow
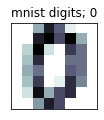
Image와 같이 행과 열을 가진 행렬 형태의 2차원 데이터는 imshow 명령으로 2차원 데이터의 크기를 색깔로 표시할 수 있다.
from sklearn.datasets import load_digits

digits = load_digits()
X = digits.images[0]
X
array([[ 0.,  0.,  5., 13.,  9.,  1.,  0.,  0.],
       [ 0.,  0., 13., 15., 10., 15.,  5.,  0.],
       [ 0.,  3., 15.,  2.,  0., 11.,  8.,  0.],
       [ 0.,  4., 12.,  0.,  0.,  8.,  8.,  0.],
       [ 0.,  5.,  8.,  0.,  0.,  9.,  8.,  0.],
       [ 0.,  4., 11.,  0.,  1., 12.,  7.,  0.],
       [ 0.,  2., 14.,  5., 10., 12.,  0.,  0.],
       [ 0.,  0.,  6., 13., 10.,  0.,  0.,  0.]])
plt.title('mnist digits; 0')
plt.imshow(X, interpolation='nearest', cmap=plt.cm.bone_r)
plt.xticks([]);  plt.yticks([])
plt.subplots_adjust(left=0.35, right=0.65, bottom=0.35, top=0.65)
plt.show()
Color map
데이터 수치를 색으로 바꾸는 함수를 color map이라고 한다. cmap 인수를 통해 사용이 가능하며, 굉장히 다양한 함수들이 있다.
dir(plt.cm)[:10]
['Accent',
 'Accent_r',
 'Blues',
 'Blues_r',
 'BrBG',
 'BrBG_r',
 'BuGn',
 'BuGn_r',
 'BuPu',
 'BuPu_r']
IX. Contour plot
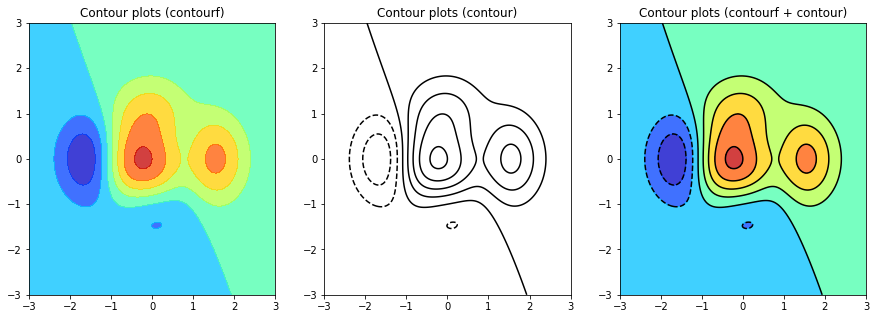
3차원 자료를 시각화하기 위해서 등고선(contour)을 사용할 수 있다.
f = lambda x, y: (1 - x / 2 + x**5 + y**3) * np.exp(-x**2 - y**2)

n = 256
x, y = np.linspace(-3, 3, n), np.linspace(-3, 3, n)
XX, YY = np.meshgrid(x, y)
ZZ = f(XX, YY)

plt.figure(figsize=(15, 5))
plt.subplot(131)
plt.title('Contour plots (contourf)')
plt.contourf(XX, YY, ZZ, alpha=.75, cmap='jet')
# plt.contour(XX, YY, ZZ, colors='black')

plt.subplot(132)
plt.title('Contour plots (contour)')
# plt.contourf(XX, YY, ZZ, alpha=.75, cmap='jet')
plt.contour(XX, YY, ZZ, colors='black')

plt.subplot(133)
plt.title('Contour plots (contourf + contour)')
plt.contourf(XX, YY, ZZ, alpha=.75, cmap='jet')
plt.contour(XX, YY, ZZ, colors='black')

plt.show()
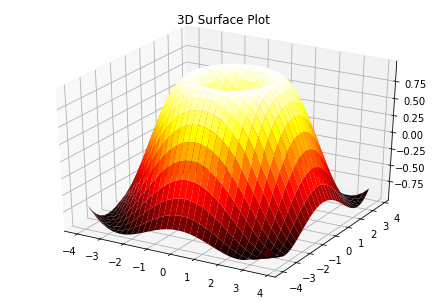
X. 3D surface plot
from mpl_toolkits.mplot3d import Axes3D

X, Y = np.arange(-4, 4, 0.25), np.arange(-4, 4, 0.25)
XX, YY = np.meshgrid(X, Y)
RR = np.sqrt(XX**2 + YY**2)
ZZ = np.sin(RR)

fig = plt.figure()
ax = Axes3D(fig)
ax.set_title('3D Surface Plot')
ax.plot_surface(XX, YY, ZZ, rstride=1, cstride=1, cmap='hot')
plt.show()
