import numpy as np
import matplotlib.pyplot as plt
%matplotlib inline
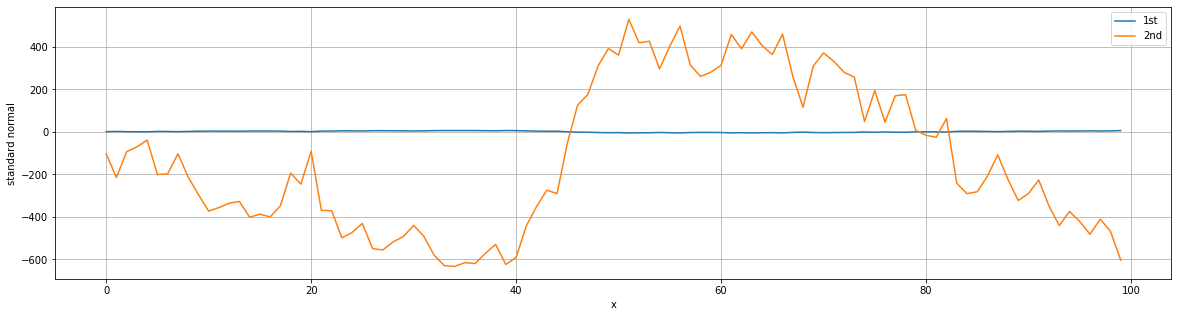
y = np.random.standard_normal([100, 2]).cumsum(axis=0)
y[:, 1] = y[:, 0] * -100
plt.figure(figsize=(20, 5))
plt.plot(y[:, 0], lw=1.5, label='1st')
plt.plot(y[:, 1], lw=1.5, label='2nd')

plt.grid();  plt.legend()
plt.xlabel('x');  plt.ylabel('standard normal');
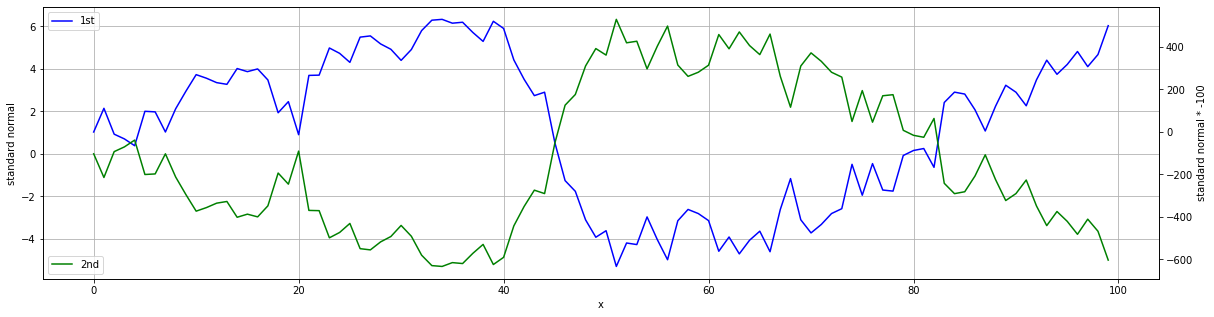
fig, ax1 = plt.subplots(figsize=(20, 5))
plt.plot(y[:, 0], 'b', label='1st')
plt.grid();  plt.legend(loc=2)
plt.xlabel('x');  plt.ylabel('standard normal')

ax2 = ax1.twinx()
plt.plot(y[:, 1], 'g', label='2nd')
plt.legend(loc=3)
plt.ylabel('standard normal * -100');
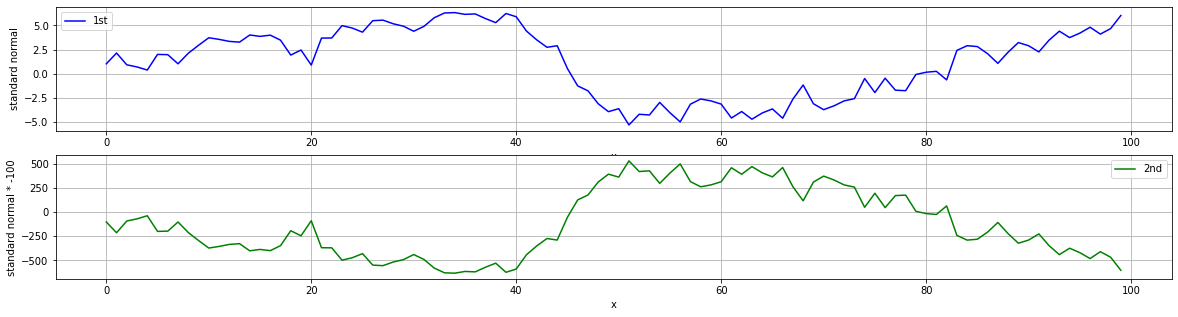
plt.figure(figsize=(20, 5))

plt.subplot(211)
plt.plot(y[:, 0], 'b', label='1st')
plt.grid();  plt.legend()
plt.xlabel('x');  plt.ylabel('standard normal')

plt.subplot(212)
plt.plot(y[:, 1], 'g', label='2nd')
plt.grid();  plt.legend()
plt.xlabel('x');  plt.ylabel('standard normal * -100');
PREVIOUSEtc